Tag: Statistics
-
What does ANOVA in Social Media Marketing?
This educational webpage introduces media students to the fundamentals of ANOVA and the t-test, two essential statistical tools for analyzing data in social media marketing. It explains how ANOVA helps compare the effectiveness of different platforms, content types, or influencer strategies
-
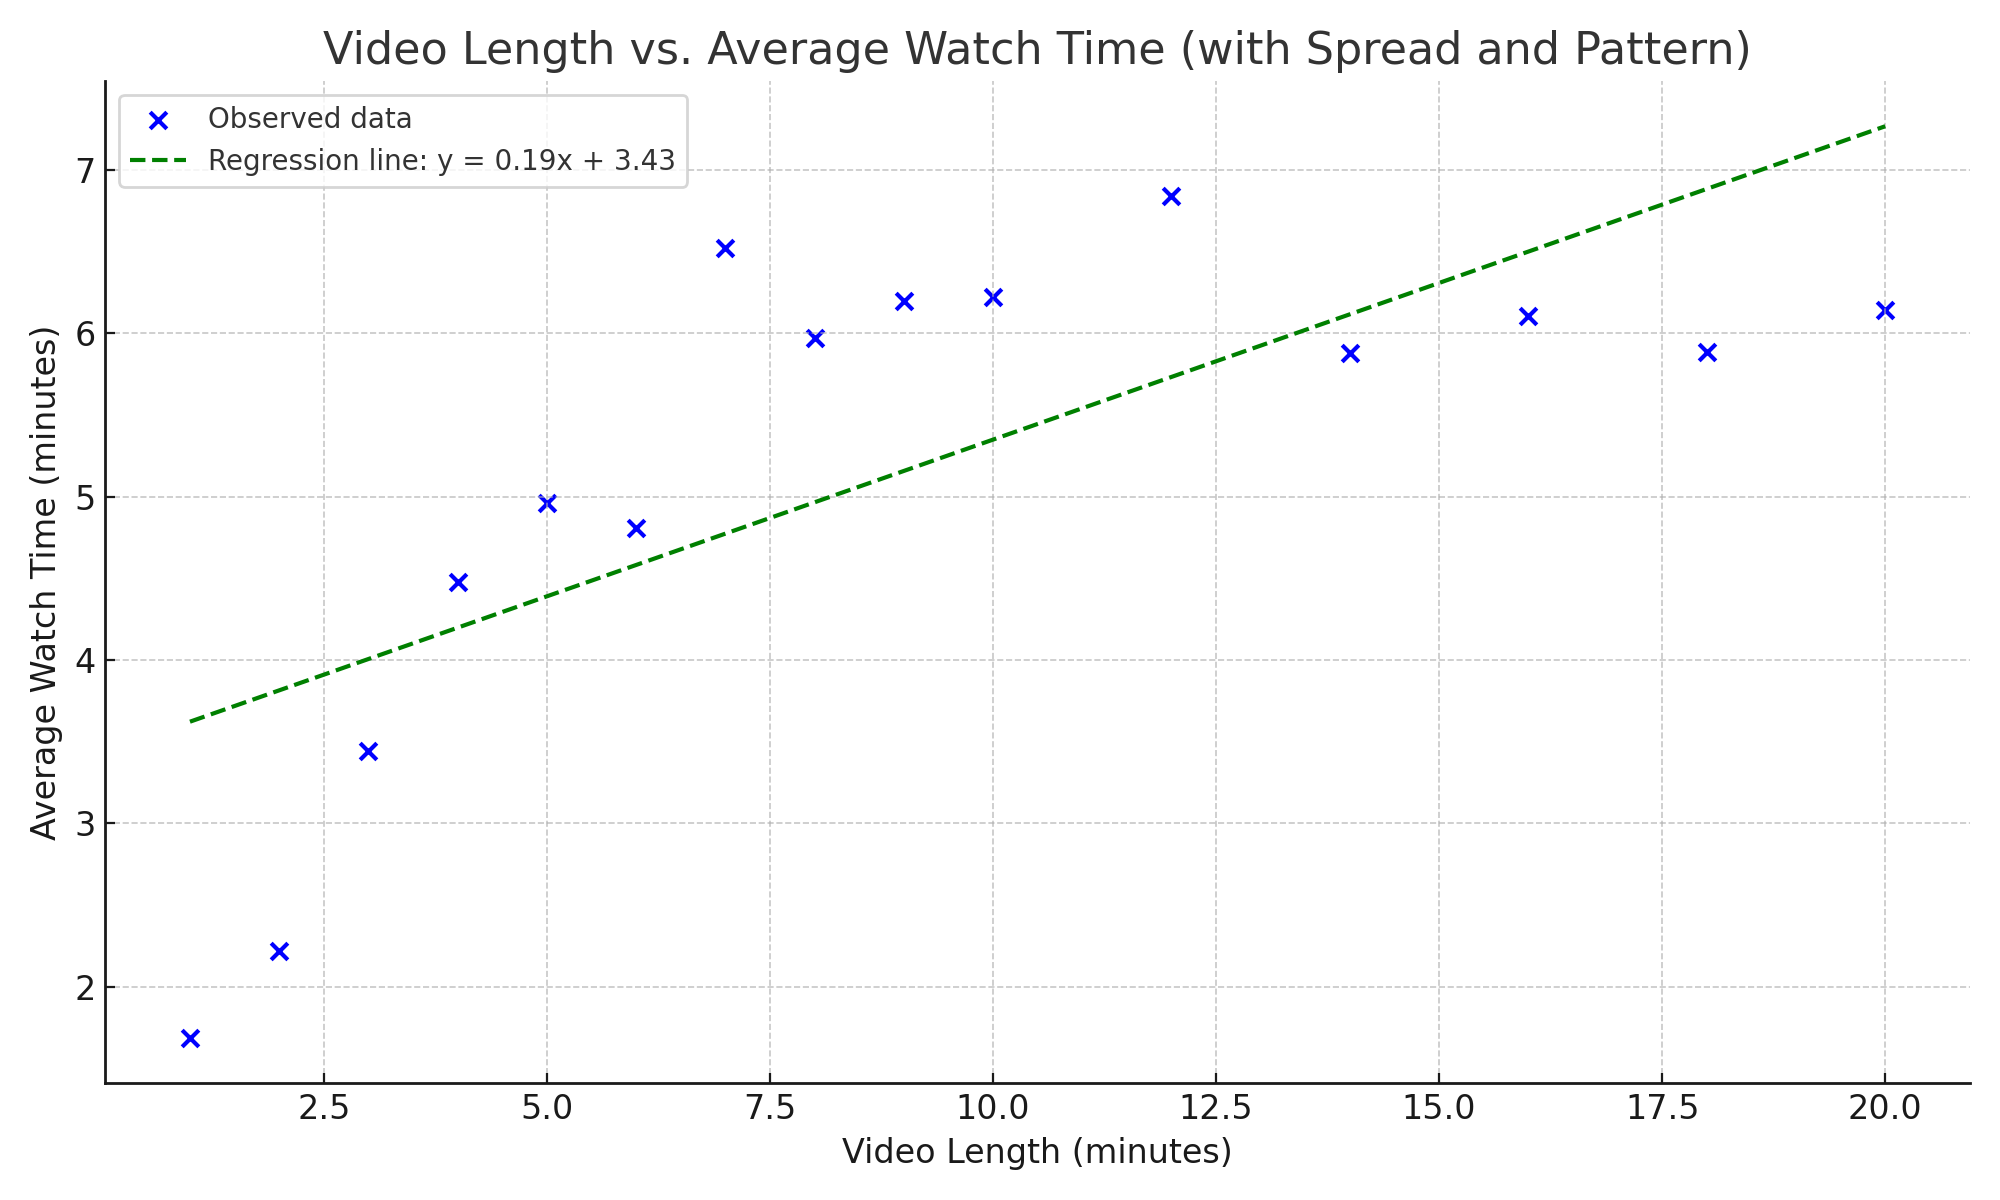
What has Linear Regression ever done for you?
Understanding Linear Regression in Media Studies This webpage offers a clear and practical introduction to linear regression tailored for students in media studies. It explains core concepts like the regression equation, slope, and intercept, and connects them directly to real-world media scenarios—such as predicting viewer engagement based on video length. The resource includes: Step-by-step guidance…
-
Confidence Interval
As a teacher, I often find that confidence intervals can be a tricky concept for students to grasp. However, they’re an essential tool in statistics that helps us make sense of data and draw meaningful conclusions. In this blog post, I’ll break down the concept of confidence intervals and explain why they’re so important in…
-
Regression
Statistical regression is a powerful analytical tool widely used in the media industry to understand relationships between variables and make predictions. This essay will explore the concept of regression analysis and its applications in media, providing relevant examples from the industry. Understanding Regression Analysis Regression analysis is a statistical method used to estimate relationships between…
-
Convenience Sampling
Convenience sampling is a non-probability sampling method where participants are selected based on their accessibility and proximity to the researcher. When citing convenience sampling in APA format, in-text citations should include the author’s last name and the year of publication. For example, “Convenience sampling is often used in exploratory research (Smith, 2020).” Convenience sampling may…
-
Min, Max and Range
In statistics, the minimum, maximum, and range are important measures used to describe the spread of data. The minimum is the smallest value in a dataset, while the maximum is the largest value. The range, which is the difference between the maximum and minimum values, provides a simple measure of variability in the data. While…
-
Overview Formulas Statistics
Mean Median Range Variance Standard Deviation Correlation Pearson’s r Correlation Spearman’s rho t-test (Independent and Dependent) Chi-Square Test These statistical tools are fundamental for analyzing data sets, allowing researchers to summarize data, assess relationships, and test hypotheses. Citations:[1] https://www.geeksforgeeks.org/mathematics-mean-variance-and-standard-deviation/[2] https://www.sciencing.com/median-mode-range-standard-deviation-4599485/[3] https://www.csueastbay.edu/scaa/files/docs/student-handouts/marija-stanojcic-mean-median-mode-variance-standard-deviation.pdf[4] https://www.youtube.com/watch?v=179ce7ZzFA8[5] https://www.youtube.com/watch?v=mk8tOD0t8M0[6] https://eng.libretexts.org/Bookshelves/Industrial_and_Systems_Engineering/Chemical_Process_Dynamics_and_Controls_(Woolf)/13:_Statistics_and_Probability_Background/13.01:_Basic_statistics-_mean_median_average_standard_deviation_z-scores_and_p-value[7] https://www.ituc-africa.org/IMG/pdf/ITUC-Af_P4_Wks_Nbo_April_2010_Doc_8.pdf[8] https://www.calculator.net/mean-median-mode-range-calculator.html
-
Standard Deviation
Standard deviation is a statistical measure that quantifies the amount of variation or dispersion in a set of values. In simpler terms, it indicates how much individual data points in a dataset deviate from the mean (average) value. A low standard deviation means that the data points tend to be close to the mean, whereas…
-
Median
The median is a measure of central tendency that represents the middle value in a data set when it is ordered from least to greatest. Unlike the mean, which can be heavily influenced by outliers, the median provides a more robust indicator of the central location of data, especially in skewed distributions (Smith, 2020). To…
-
Mode
The mode is a statistical measure that represents the most frequently occurring value in a data set. Unlike the mean or median, which require numerical calculations, the mode can be identified simply by observing which number appears most often. This makes it particularly useful for categorical data where numerical averaging is not possible. For example,…
-
Mean
The mean, often referred to as the average, is a measure of central tendency that is widely used in statistics to summarize a set of data. It is calculated by summing all the values in a dataset and then dividing by the number of values. This measure provides a single value that represents the center…
-
Sampling
Sampling is a fundamental concept in research methodology, referring to the process of selecting a subset of individuals or observations from a larger population to make inferences about the whole (Creswell & Creswell, 2018). This process is crucial because it allows researchers to conduct studies more efficiently and cost-effectively, without needing to collect data from…
-
Convenience Sampling
Convenience sampling is a non-probability sampling technique where participants are selected based on their ease of access and availability to the researcher, rather than being representative of the entire population (Scribbr, 2023; Simply Psychology, 2023). This method is often used in preliminary research or when resources are limited, as it allows for quick and inexpensive…
-
Chi Square test
The Chi-Square test is a statistical method used to determine if there is a significant association between categorical variables or if a categorical variable follows a hypothesized distribution. There are two main types of Chi-Square tests: the Chi-Square Test of Independence and the Chi-Square Goodness of Fit Test. The Chi-Square Test of Independence assesses whether…
-
Correlation (Scale Variables)
Correlation for scale variables is often assessed using the Pearson correlation coefficient, denoted as $$ r $$, which measures the linear relationship between two continuous variables (Statology, n.d.; Scribbr, n.d.). The value of $$ r $$ ranges from -1 to 1, where -1 indicates a perfect negative linear correlation, 0 indicates no linear correlation, and…
-
Correlation Ordinal Variables
Correlation for ordinal variables is typically assessed using Spearman’s rank correlation coefficient, which is a non-parametric measure suitable for ordinal data that does not assume a normal distribution (Scribbr, n.d.). Unlike Pearson’s correlation, which requires interval or ratio data and assumes linear relationships, Spearman’s correlation can handle non-linear monotonic relationships and is robust to outliers.…
-
Reporting Significance levels (Chapter 17)
Introduction In the field of media studies, understanding and reporting statistical significance is crucial for interpreting research findings accurately. Chapter 17 of “Introduction to Statistics in Psychology” by Howitt and Cramer provides valuable insights into the concise reporting of significance levels, a skill essential for media students (Howitt & Cramer, 2020). This essay will delve…
-
Probability (Chapter 16)
Chapter 16 of “Introduction to Statistics in Psychology” by Howitt and Cramer provides a foundational understanding of probability, which is crucial for statistical analysis in media research. For media students, grasping these concepts is essential for interpreting research findings and making informed decisions. This essay will delve into the relevance of probability in media research,…
-
Chi Square test (Chapter 15)
The Chi-Square test, as introduced in Chapter 15 of “Introduction to Statistics in Psychology” by Howitt and Cramer, is a statistical method used to analyze frequency data. This guide will explore its core concepts and practical applications in media research, particularly for first-year media students. Understanding Frequency Data and the Chi-Square Test The Chi-Square test…
-
Unrelated t-test (Chapter14)
Unrelated T-Test: A Media Student’s Guide Chapter 14 of “Introduction to Statistics in Psychology” by Howitt and Cramer (2020) provides an insightful exploration of the unrelated t-test, a statistical tool that is particularly useful for media students analyzing research data. This discussion will delve into the key concepts, applications, and considerations of the unrelated t-test…
-
Related t-test (Chapter13)
Introduction The related t-test, also known as the paired or dependent samples t-test, is a statistical method extensively discussed in Chapter 13 of “Introduction to Statistics in Psychology” by Howitt and Cramer. This test is particularly relevant for media students as it provides a robust framework for analyzing data collected from repeated measures or matched…
-
Correlation (Chapter 8)
Understanding Correlation in Media Research: A Look at Chapter 8 Correlation analysis is a fundamental statistical tool in media research, allowing researchers to explore relationships between variables and draw meaningful insights. Chapter 8 of “Introduction to Statistics in Psychology” by Howitt and Cramer (2020) provides valuable information on correlation, which can be applied to media…
-
Relationships Between more than one variable (Chapter 7)
Exploring Relationships Between Multiple Variables: A Guide for Media Students In the dynamic world of media studies, understanding the relationships between multiple variables is crucial for analyzing audience behavior, content effectiveness, and media trends. This essay will explore various methods for visualizing and analyzing these relationships, adapting concepts from statistical analysis to the media context.…
-
Standard Deviation (Chapter 6)
The standard deviation is a fundamental statistical concept that quantifies the spread of data points around the mean. It provides crucial insights into data variability and is essential for various statistical analyses. Calculation and Interpretation The standard deviation is calculated as the square root of the variance, which represents the average squared deviation from the…
-
Guide SPSS How to: Calculate the Standard Error
Here’s a guide on how to calculate the standard error in SPSS: Method 1: Using Descriptive Statistics Method 2: Using Frequencies Method 3: Using Compare Means Tips: Remember, the standard error is an estimate of how much the sample mean is likely to differ from the true population mean[6]. It’s a useful measure for assessing…
-
Standard Error (Chapter 12)
Understanding Standard Error for Media Students Standard error is a crucial statistical concept that media students should grasp, especially when interpreting research findings or conducting their own studies. This essay will explain standard error and its relevance to media research, drawing from various sources and adapting the information for media students. What is Standard Error?…
-
Guide SPSS How to: Calculate ANOVA
Here’s a step-by-step guide for 1st year students on how to calculate ANOVA in SPSS: Step 1: Prepare Your Data Step 2: Run the ANOVA Step 3: Additional Options Step 4: Post Hoc Tests Step 5: Run the Analysis Click “OK” in the main One-Way ANOVA dialog box to run the analysis Step 6: Interpret…
-
Guide SPSS How to: Calculate the dependent t-test
Here’s a guide for 1st year students on how to calculate the dependent t-test in SPSS: Step-by-Step Guide for Dependent t-test in SPSS 1. Prepare Your Data 2. Open SPSS and Enter Data 3. Run the Test 4. Interpret the Results 5. Report the Results Tips: Remember, practice with sample datasets will help you become…
-
Guide SPSS How to: Calculate the independent t-test
Step-by-Step Guide Interpreting the Results Tips
-
Guide SPSS How to: Calculate Chi Square
Interpreting the Results Main Weakness of Chi-square Test The main weakness of the Chi-square test is its sensitivity to sample size[3]. Specifically: To address this weakness, always check the “Expected Count” in your output to ensure the assumption is met. If not, consider combining categories or using alternative tests for small samples, such as Fisher’s…
-
Guide SPSS How to: Correlation
Calculating Correlation in SPSS Step 1: Prepare Your Data Step 2: Access the Correlation Analysis Tool Step 3: Select Variables Step 4: Choose Correlation Coefficient Step 5: Additional Options Step 6: Run the Analysis Interpreting the Results Correlation Coefficient Statistical Significance Sample Size Remember, correlation does not imply causation. Always interpret your results in the…
-
Guide SPSS how to: Measures of Central Tendency and Measures of Dispersion
Here’s a guide for 1st year students to calculate measures of central tendency and dispersion in SPSS: Calculating Measures of Central Tendency Calculating Measures of Dispersion Interpreting the Results Choosing the Appropriate Measure Remember, if your distribution is skewed, the median may be more appropriate than the mean for interval/ratio data.
-
Anova and Manova
Exploring ANOVA and MANOVA Techniques in Marketing and Media Studies Analysis of Variance (ANOVA) and Multivariate Analysis of Variance (MANOVA) are powerful statistical tools that can provide valuable insights for marketing and media studies. Let’s explore these techniques with relevant examples for college students in these fields. Repeated Measures ANOVA Repeated Measures ANOVA is used…
-
Data Analysis (Section D)
Ever wondered how researchers make sense of all the information they collect? Section D of Matthews and Ross’ book is your treasure map to the hidden gems in data analysis. Let’s embark on this adventure together! Why Analyze Data? Imagine you’re a detective solving a mystery. You’ve gathered all the clues (that’s your data), but…
-
Statistical Analysis (chapter D3)
As first-year students, you might be wondering why we’re diving into statistics. Trust me, it’s not just about crunching numbers – it’s about unlocking the secrets of society! Why Statistical Analysis Matters Imagine you’re a detective trying to solve the mysteries of human behavior. That’s essentially what we do in social research! Statistical analysis is…
-
Chi Square
Chi-square is a statistical test widely used in media research to analyze relationships between categorical variables. This essay will explain the concept, its formula, and provide an example, while also discussing significance and significance levels. Understanding Chi-Square Chi-square (χ²) is a non-parametric test that examines whether there is a significant association between two categorical variables.…
-
Correlation Spearman and Pearson
Correlation is a fundamental concept in statistics that measures the strength and direction of the relationship between two variables. For first-year media students, understanding correlation is crucial for analyzing data trends and making informed decisions. This essay will explore two common correlation coefficients: Pearson’s r and Spearman’s rho. Pearson’s Correlation Coefficient (r) Pearson’s r is…
-
Type I and Type II errors
Type I and Type II errors are two statistical concepts that are highly relevant to the media industry. These errors refer to the mistakes that can be made when interpreting data, which can have significant consequences for media reporting and analysis. Type I error, also known as a false positive, occurs when a researcher or…
-
Introduction into Statistics ( Chapter 2 and 3)
Howitt and Cramer Chapter 2 and 3Variables, concepts, and models form the foundation of scientific research, providing researchers with the tools to investigate complex phenomena and draw meaningful conclusions. This essay will explore these elements and their interrelationships, as well as discuss levels of measurement and the role of statistics in research. Concepts and Variables…
-
Shapes of Distributions (Chapter 5)
Probability distributions are fundamental concepts in statistics that describe how data is spread out or distributed. Understanding these distributions is crucial for students in fields ranging from social sciences to engineering. This essay will explore several key types of distributions and their characteristics. Normal Distribution The normal distribution, also known as the Gaussian distribution, is…
-
Univariate Analysis: Understanding Measures of Central Tendency and Dispersion
Univariate analysis is a statistical method that focuses on analyzing one variable at a time. In this type of analysis, we try to understand the characteristics of a single variable by using various statistical techniques. The main objective of univariate analysis is to get a comprehensive understanding of a single variable, its distribution, and its…
-
Bivariate Analysis: Understanding Correlation, t-test, and Chi Square test
Bivariate analysis is a statistical technique used to examine the relationship between two variables. This type of analysis is often used in fields such as psychology, economics, and sociology to study the relationship between two variables and determine if there is a significant relationship between them. Correlation Correlation is a measure of the strength and…
-
Distributions
When working with datasets, it is important to understand the central tendency and dispersion of the data. These measures give us a general idea of how the data is distributed and what its typical values are. However, when the data is skewed or has outliers, it can be difficult to determine the central tendency and…
-
Dependent t-test
The dependent t-test, also known as the paired samples t-test, is a statistical method used to compare the means of two related groups, allowing researchers to assess whether significant differences exist under different conditions or over time. This test is particularly relevant in educational and psychological research, where it is often employed to analyze the…
-
Independent t-test
The independent t-test, also known as the two-sample t-test or unpaired t-test, is a fundamental statistical method used to assess whether the means of two unrelated groups are significantly different from one another. This inferential test is particularly valuable in various fields, including psychology, medicine, and social sciences, as it allows researchers to draw conclusions…