Understanding Linear Regression in Media Studies
What is Linear Regression?
Linear regression is a statistical tool used to explore the relationship between two variables. It helps us predict the value of one variable (the dependent variable) based on the value of another (the independent variable).
Mathematically, it is represented as:
Y = a + bX
- Y is the dependent variable (what you are trying to predict)
- X is the independent variable (the predictor)
- a is the intercept (value of Y when X = 0)
- b is the slope (change in Y for every one-unit change in X)
Why is This Useful in Media Studies?
In media research, regression can help you:
- Determine how advertising spend affects audience reach
- See how video length impacts viewer retention
- Predict social media engagement based on posting frequency
Example Scenario
You’re analyzing how the length of YouTube videos (X) affects the average watch time (Y). By collecting data from several videos, you can perform a regression analysis to find a trend line that best represents this relationship.
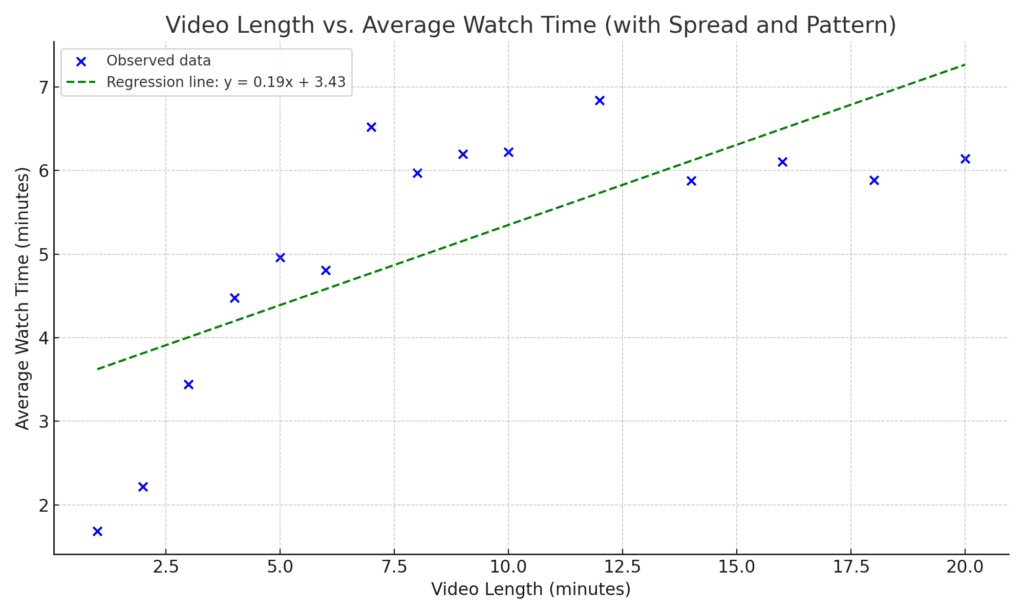
*Chart of YouTube video length vs. average watch time
If your regression equation comes out as Y = 2 + 0.5X, it suggests that for every extra minute of video, average watch time increases by 0.5 minutes.
How to Perform Regression Analysis
- Gather paired data points (e.g., video length and watch time)
- Plot the data to see the relationship visually
- Use software like Excel, R, Python, or Google Sheets to compute the regression
- Interpret the slope and intercept in the context of your question
Important Concepts
- Correlation vs. Causation: Just because two variables are related doesn’t mean one causes the other.
- R-squared (R²): A measure of how well the regression line fits the data (closer to 1 = better fit).
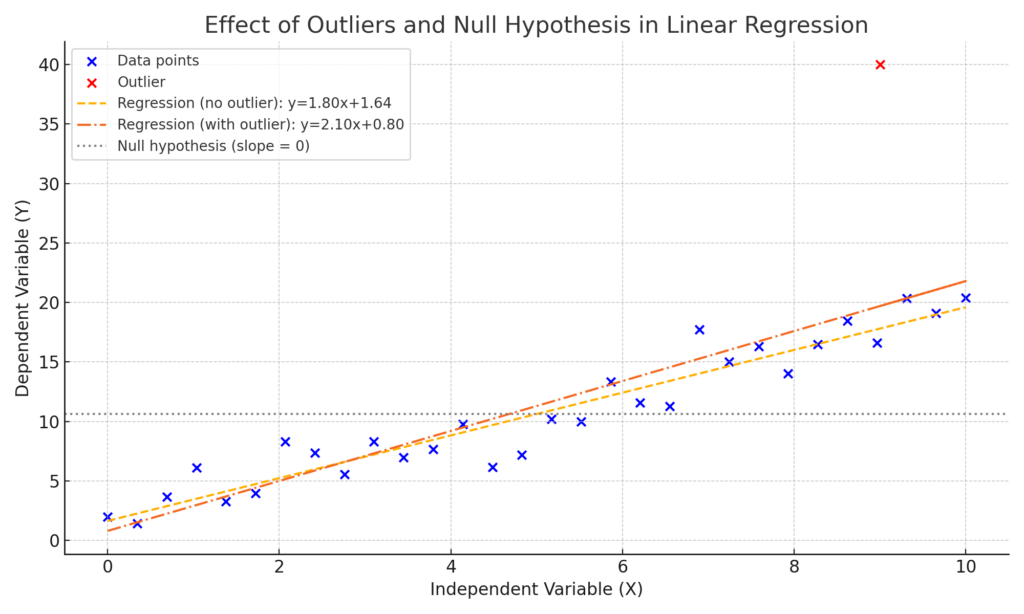
- Outliers: Points that don’t fit the pattern. These can strongly affect your results.
Try It Yourself
Choose a dataset from your media analysis—like social media posts, video performance, or ad campaigns. Plot the data and calculate the regression line. What does the slope tell you? Can you make a prediction based on it?