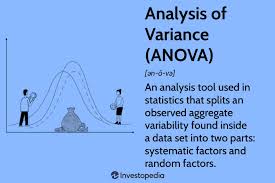
This webpage is designed to help media students grasp the importance of statistical tools like ANOVA and the t-test, especially in the context of social media marketing. These methods allow marketers to make evidence-based decisions by comparing group means.
What is ANOVA?

ANOVA, or Analysis of Variance, is a statistical method used to compare the means of three or more groups. It helps determine whether at least one of the group means is significantly different from the others.
The reasoning behind ANOVA is rooted in analyzing the variance within and between groups to see if the group membership has a statistically significant effect on the outcome variable. Here’s how it works:
- Total Variation (SST): This measures the overall variability in the dataset without considering group membership.
- Between-group Variation (SSM): This is the part of the total variation explained by the group differences. If group means are different, this value will be higher.
- Within-group Variation (SSE): This captures the random variation within each group. It reflects noise or individual differences that are not due to group effects.
ANOVA compares these two types of variation using the F-statistic. A high F-value suggests that the group means differ more than would be expected by chance. This helps answer questions like: “Is the engagement rate really different across platforms, or could the differences just be random fluctuations?”
What is a t-test?
The t-test is used when comparing the means of two groups. It’s ideal for smaller-scale analyses and helps determine if the observed difference is statistically significant.
- Independent t-test: Compares means between two unrelated groups.
- P-value: If below 0.05, the difference is considered statistically significant.
When to Use ANOVA vs. t-test?
Use a t-test when comparing two groups. Use ANOVA when comparing three or more groups. If ANOVA shows a significant result, follow-up tests (like the t-test with Bonferroni correction) are used to pinpoint which groups differ.
Examples in Social Media Marketing
1. Platform Comparison (ANOVA)
Compare engagement rates of the same campaign on Facebook, Instagram, and Twitter using ANOVA to see if there’s a significant difference.
2. Content Type Comparison (ANOVA)
Evaluate whether videos, images, or text posts generate more clicks or shares across a social campaign.
3. A/B Testing (t-test)
Test two different headlines for an ad on Instagram. Use a t-test to determine if one headline performs significantly better.
4. Influencer Performance (ANOVA + t-test)
Run an ANOVA to compare three influencers’ impacts on product sales. If significant, conduct t-tests between pairs of influencers to find where the differences lie.
Why This Matters for Media Students
Understanding these statistical methods equips you with analytical skills to evaluate campaign performance, justify marketing decisions, and present data confidently to stakeholders.
