When working with datasets, it is important to understand the central tendency and dispersion of the data. These measures give us a general idea of how the data is distributed and what its typical values are. However, when the data is skewed or has outliers, it can be difficult to determine the central tendency and dispersion accurately. In this blog post, we’ll explore how to deal with skewed datasets and how to choose the appropriate measures of central tendency and dispersion.
What is a Skewed Dataset?
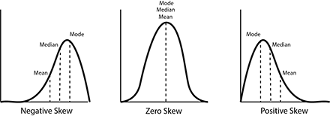
A skewed dataset is one in which the values are not evenly distributed. Instead, the data is skewed towards one end of the scale. There are two types of skewness: positive and negative. In a positive skewed dataset, the values are skewed to the right, while in a negative skewed dataset, the values are skewed to the left.
Measures of Central Tendency
Measures of central tendency are used to determine the typical value or center of a dataset. The three most commonly used measures of central tendency are the mean, median, and mode.
- Mean: The mean is the sum of all the values in the dataset divided by the number of values. It gives us an average value for the dataset.
- Median: The median is the middle value in a dataset. If the dataset has an odd number of values, the median is the value in the middle. If the dataset has an even number of values, the median is the average of the two middle values.
- Mode: The mode is the value that occurs most frequently in the dataset.
In a skewed dataset, the mean is often skewed in the same direction as the data. This means that the mean may not accurately represent the typical value in a skewed dataset. In these cases, the median is often a better measure of central tendency. The median gives us the middle value in the dataset, which is not affected by outliers or skewness.
Measures of Dispersion
Measures of dispersion are used to determine how spread out the values in a dataset are. The two most commonly used measures of dispersion are the range and the standard deviation.
- Range: The range is the difference between the highest and lowest values in the dataset.
- Standard deviation: The standard deviation is a measure of how much the values in a dataset vary from the mean.
In a skewed dataset, the range and standard deviation may be affected by outliers or skewness. In these cases, it is important to use other measures of dispersion, such as the interquartile range or trimmed mean, to get a more accurate representation of the dispersion in the data.
When dealing with skewed datasets, it is important to choose the appropriate measures of central tendency and dispersion. The mean, median, and mode are measures of central tendency, while the range and standard deviation are measures of dispersion. In a skewed dataset, the mean may not accurately represent the typical value, and the range and standard deviation may be affected by outliers or skewness. In these cases, it is often better to use the median or other measures of dispersion to get a more accurate representation of the data.