If you’re a student, researcher, or professional working in the field of statistics, you’ve likely heard of Z-scores. But why use Z-scores in your data analysis? In this blog post, we’ll explain why Z-scores can be so beneficial to your data analysis and provide examples of how to use them in your quantitative research. By the end of this post, you’ll have a better understanding of why Z-scores are so important and how to use them in your research.
(Image Suggestion: A graph showing a data set represented by Z-scores, highlighting the transformation of the data points in relation to the mean and standard deviation.)
What are Z-Scores?
Are you interested in developing a better understanding of statistics and quantitative research? If so, you’ve come to the right place! Today, we will delve into the topic of Z-Scores and their significance in statistics.
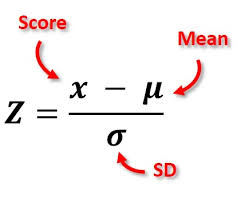
Z-Scores are numerical scores that indicate how many standard deviations an observation is from the mean. In other words, a Z-Score of 0 represents a data point that is exactly equal to the mean. A Z-Score of 1 indicates data one standard deviation above the mean, while -1 represents data one standard deviation below the mean.
Using Z-Scores enables us to normalize our data and provide context for each value relative to all other values in our dataset. This facilitates the comparison of values from different distributions and helps to minimize bias when evaluating two groups or samples. Furthermore, it provides an overall measure of how distinct a given score is from the mean, which is particularly useful for identifying extreme outliers or determining relative standing within a group or sample.
Additionally, Z-Scores can also inform us about the probability of a specific value occurring within a dataset, taking its position relative to the mean into account. This additional feature enhances the usefulness of Z-Scores when interpreting quantitative research results. Each distribution has its own set of unique probabilities associated with specific scores, and understanding this information empowers us to make more informed decisions regarding our datasets and draw meaningful conclusions from them.
Understanding the Benefits of Using Z-Scores in Statistics
Are you searching for a method to compare two datasets or interpret statistical results? If so, using Z-scores could be the solution. Z-scores are a statistical tool employed to determine the distance of an individual measurement from the mean value in a given dataset. This facilitates data comparison across different sample sizes and distributions, as well as the identification of outliers and trends.
The use of Z-scores offers numerous advantages over alternative statistics like raw scores or percentages. For instance, as it is not affected by outliers or extremes, it can yield more accurate outcomes compared to raw scores. Moreover, it is non-directional, disregarding whether a score is above or below the mean, making result interpretation less complicated.
Utilizing Z-scores also permits the quantification of individual performance in relation to a larger group, offering valuable insights into data set variability. Additionally, it provides a simple way to identify subtle patterns and trends that might be overlooked using other quantitative analysis methods like linear regression or chi-square tests. Finally, when employed in hypothesis testing, Z-scores aid in calculating confidence intervals. This allows for more precise measurements of the level of confidence one can have in their conclusions based on the sample size and distribution type.
Overall, correct comprehension and application of Z-scores can deliver significant benefits in statistical research and analysis, empowering more accurate decision-making.
Examples of How to Use Z-Scores in Quantitative Research
In quantitative research, z-scores are a useful tool for analyzing data and making informed decisions. Z-scores allow you to compare variables from different distributions, quantify how much a value differs from the mean, and make statements about the significance of results for inference testing. They are also used to standardize data, which can be used for comparison purposes and detect outliers in data sets.
Z-scores can be especially helpful when looking at two or more sets of data by converting them to a common scale. Using z-scores allows you to compare and analyze data from different populations without having to adjust for differences in magnitude between the two datasets. Z-scores can also help you identify relationships between variables in your quantitative research study, as well as determine statistical significance between two or more sets of data.
In addition, z-scores can be used to standardize data within a population, which is important for making proper inferences about the data. Finally, z-scores can be used to calculate correlation coefficients that measure the degree of linear association between two variables. All these uses make z-scores an invaluable tool in quantitative research that should not be overlooked!
In Conclusion
Z-scores are powerful tools for data analysis and quantitative research, making them invaluable assets in any statistician’s arsenal. Their ability to standardize data across distributions, identify outliers, and measure correlation coefficients makes them must-haves for all statistical research. With a better understanding of Z-scores, you can make more informed decisions based on your data sets and draw meaningful conclusions from your quantitative research. So don’t wait – start utilizing the power of Z-scores to improve your results today!